INFO
The Following Project was done for the European Space Agency and is a detailed description of the design and development process
Due to confidential information, there is limited visual information displayed
— PROJECT NAME
One Web
— ROLE
Lead UI/UX Designer
— TOOLS
Adobe Xd, SCRUM, Adobe Illustrator, Microsoft Visio, Figma
THE PROJECT
OneWeb is undertaking an ambitious initiative to deploy a mega constellation comprising 650 low Earth orbit (LEO) satellites. The primary goal is to collaborate with enterprises and governments to provide high-speed internet access globally.
For more information, click here.
CGI was engaged by OneWeb to develop a comprehensive monitoring and management system from the ground up, capable of overseeing the operation of all 650 satellites.
THE CHALLENGE
The core challenge was to design an effective, efficient, and user-friendly interface capable of accommodating 650 satellites. The interface needed to enable operators to easily identify potential issues and system errors.
KEY OBJECTIVE
As the project lead, my primary objective was to identify the optimal combination of design practices suitable for a system of this magnitude.
Another critical objective was to integrate the expertise of engineers and designers to create a functional and user-centric solution from scratch.
Throughout the project's various stages, we employed agile methodologies, which allowed us to revisit and refine previous systems to address challenges encountered during sprints.
1. Discover
How to support 648 satellites?
A system of such extend has never been done before successfully.
648 satellites means
- • 18 planes
- Dividing them into 18 planes, circling the earth
- • 36 satellites per plane
- Each plane will have 36 satellites one after the other, like a train
Identifying the best monitoring system
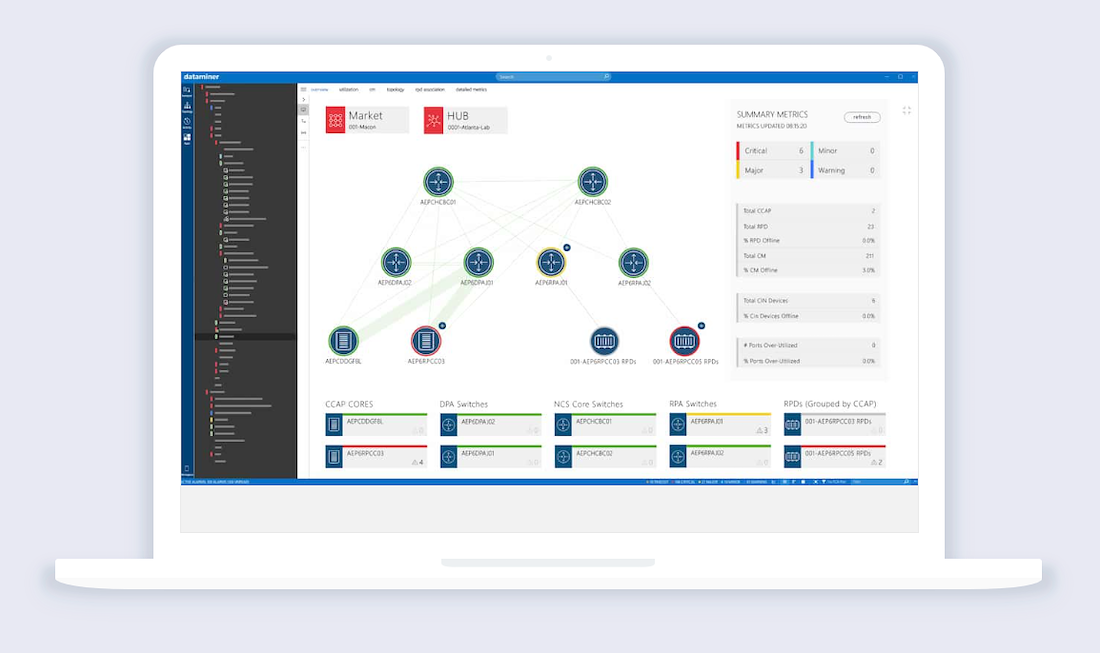
Based on previous projects and experience. Skyline Dataminer is the best network monitoring and orchestration management system because it offers security, complexity and mutli-cloud support for large data with multiple connection points
Identifying potential problems in a system of such scale can be tricky, the information architecture has to be efficient effective and usable.

Designing an Alpha supporting 10 satellites
The first step to approaching this system was to design an Alpha to test the infrastructure and support 10 satellites.
The thought process behind this was to build a strong infrastructure with the necessary design principles and ideas to support the expantion of the system to 648 satellites
The Alpha phase timeframe was 1 year

2. Define
Expert User Research
Three 1 on 1 expert user interview were conducted in order to obtain more information about the needs of the operators handling the monitoring system.
One was the head of the operators team and two operators were gathered for this user test
Some of the comments were
Head of Operations – Christopher
"I have hard time with current monitoring systems user experience, in my 12 year carreer i have seen little change in usability
Operator #1 – Georg
- " As an operator I am always looking to make my life easier by creating custom Python executables because the system does not let me do certain action that I want"
Operator #2 – Michel
- " Monitoring systems in the space industry have been long outdated in terms of UI and UX Design, this a big factor in the One Web project that we want to excell"
Contact
email@domain.com
000-000-000
Persona & User Journeys
UX DESIGN
The data from the expert user research was organised and
visualized by creating a persona and mapping out his user journey
Defined Goals
User Friendly
- - Design a usable and user friendly layout so user dont have to create custom code to do actions
- - Design user flows that are customized for operators
Adaptable to the operators needs
- Add custom colors and interactions- - Design a quick way to dive into the root of the problems
3. Develop
Development of Design Guidelines Baseline
Based on the expert user interviews and user personas we extracted all the information and created a series of design guidelines baseline. The system is going to be structure and developed based on the following
Layer Structure
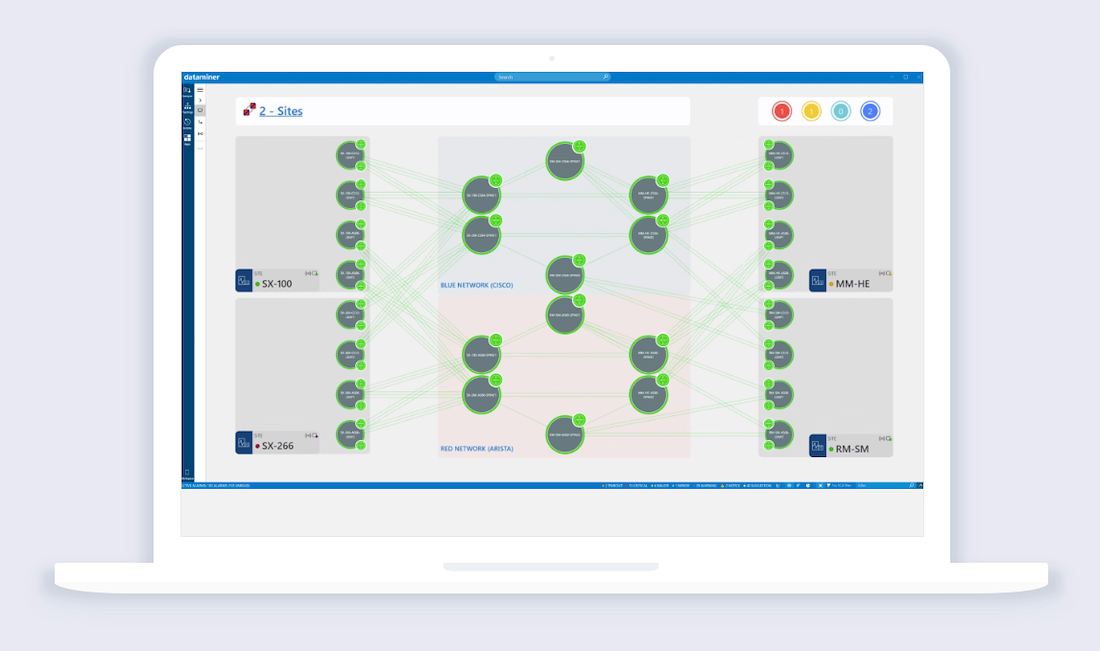
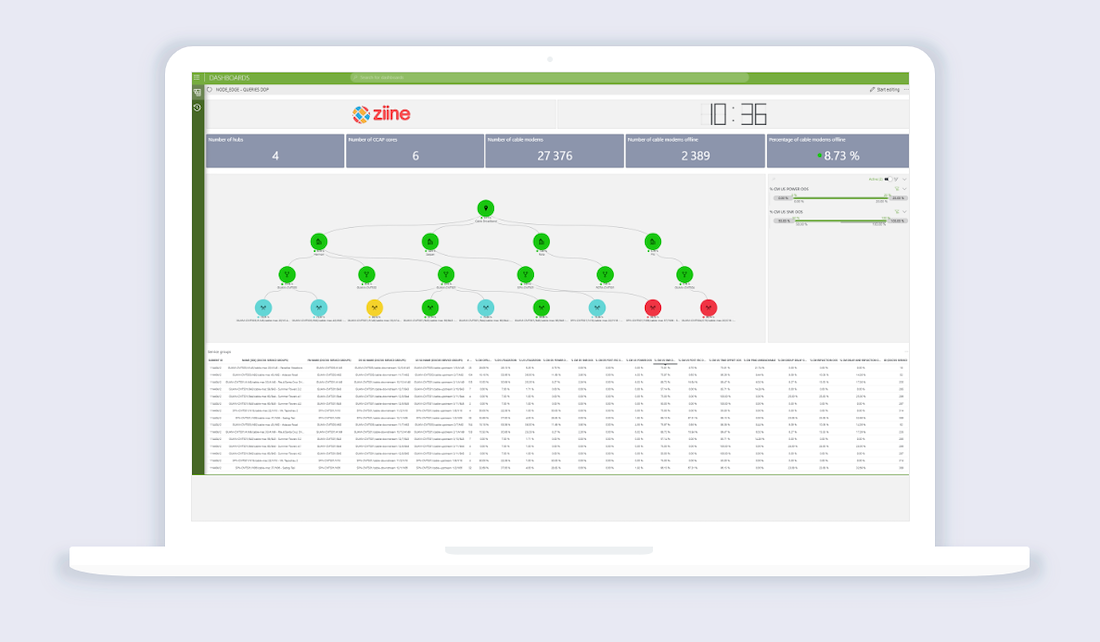
The one web project will be divided into three types of views. The physical view, the logical view and the numerical view; the system was divided in order to show different aspects of the system on different views. Each component of the system will have a physical and logical view, whereas some components will include also a numerical view. This separation will help the user identify specific information and navigate the system faster and more efficient. The figure below shows specifically how the system is going to be separated and the arrows represent the possibilities of navigating through the system.

CEM View Architecture
The CEM views are organized into three specific types
- - There are Physical views
- - Logical views
- - Numeric View views
The principle behind these displays is that the system can be monitored at a high level and errors will ‘bubble up’ to the higher levels. The hierarchy allows the Operator to drill down in a logical way to the source of the problem so that the detailed information can be used to diagnose any problems.

Mobile Structure
The one web team also asked us to create a shorter version of the system on mobile so that operators can have a quick overview of everything that is going on even outside the office. You can see the flow charts of the mobile version on your left

User Testing and Delivery of High Fidelity Working System DEMO
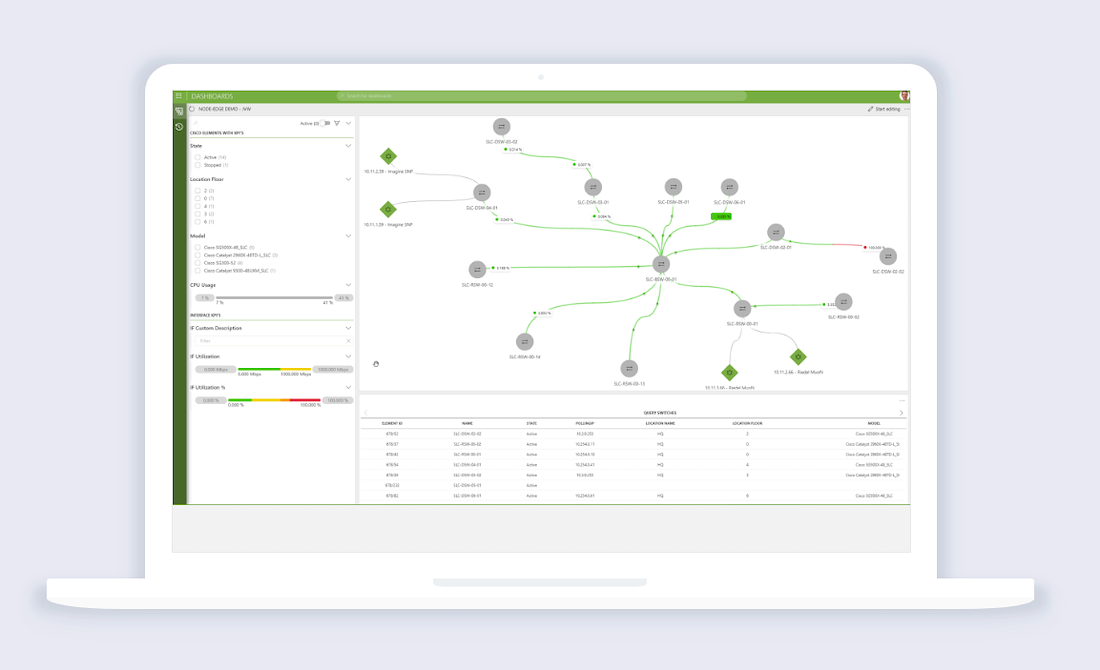
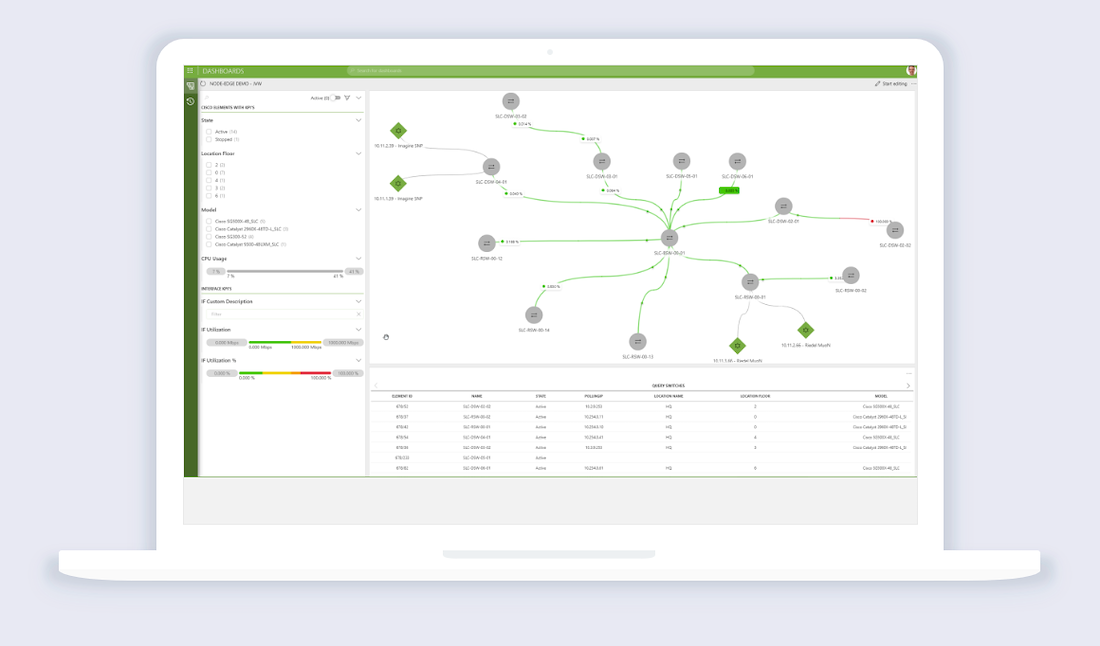
- - Limitations: The use of Microsoft Visio was required in order to develop the following UI because of integration issues with Skyline Dataminer
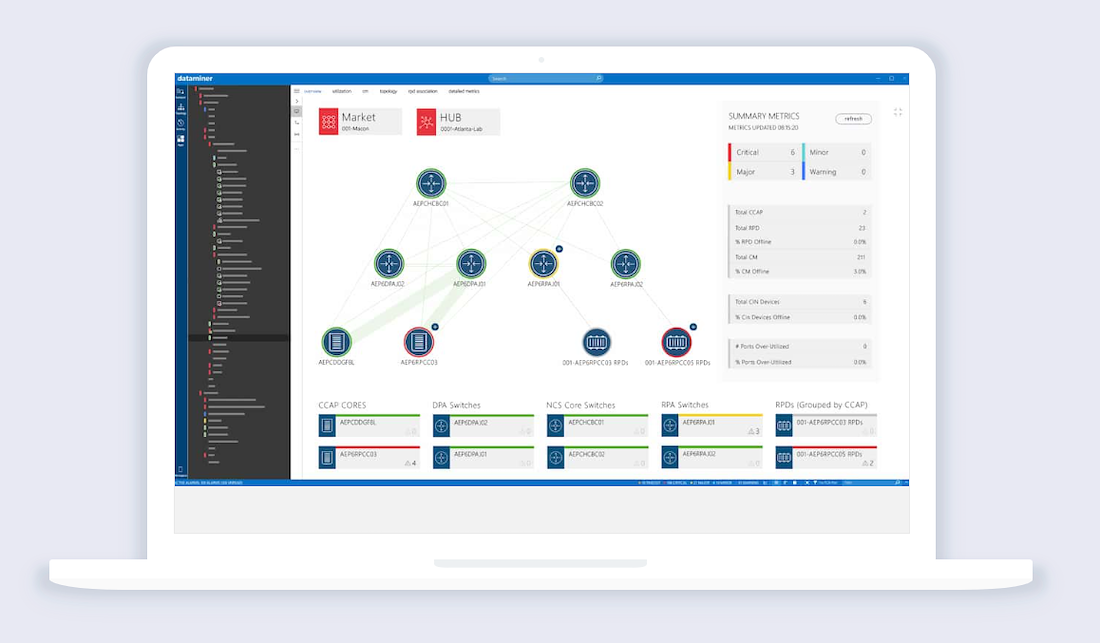
During this phase there were 6 months of iterations between the stakeholders and our team to be able to deliver a DEMO with 10 satellites working and all the ground stations.
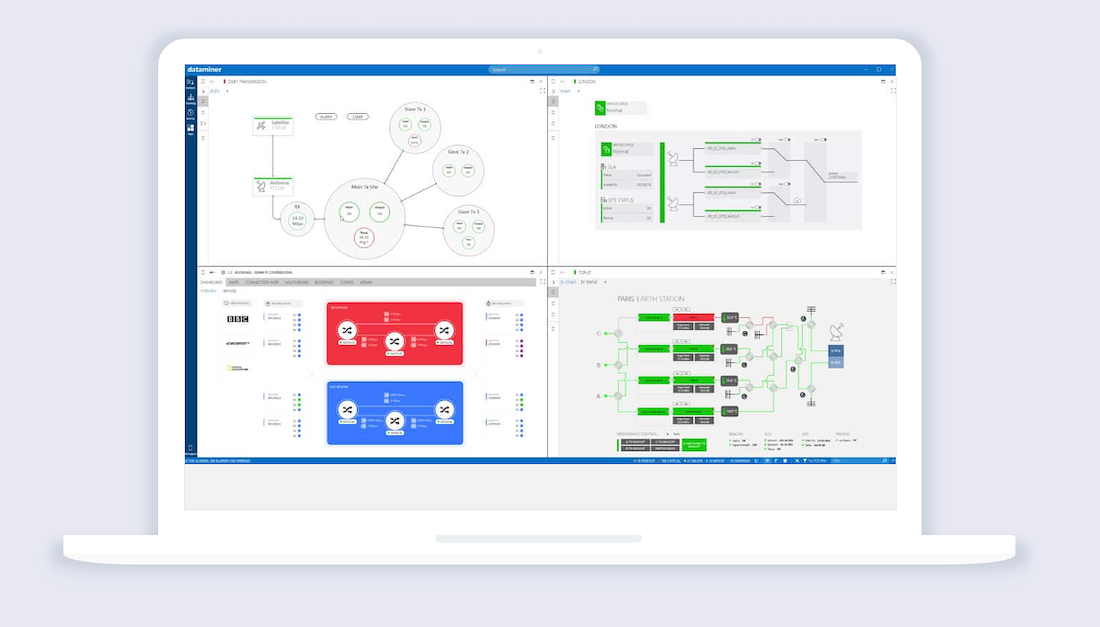
On your left you can see the Ground Station View, a series of GroundStation around the world waiting for input from the satellites.
On the pictures below you can find some first versions of the UI on Skyline Dataminer, the information structure that I have developed and the UI/UX based on expert user feedback.

4. Design
High Fidelity Prototypes
High Fidelity Prototypes
with Figma
Delivery took place in Washington DC presenting the DEMO to OneWeb
What I learned?
All in all, a project of such scale gave me a chance to work with the best in my field and collaborate with great minds and solve problems that were previously not solvable. Creating a system from scratch is scary at first but trusting in the process can get you great results.
The main outcome of this project is that, as a team, you can achieve anything, removing the ego and being compassionate and collaborative with your peers is key to success for any project, let alone to projects that have never been done before.
A big thank you to my team that believed in me and helped me through the hard times
19 Iterations
200+ UI’s
8 Demo’s
Contact
email@domain.com
000-000-000